


Your Org Charting Pro
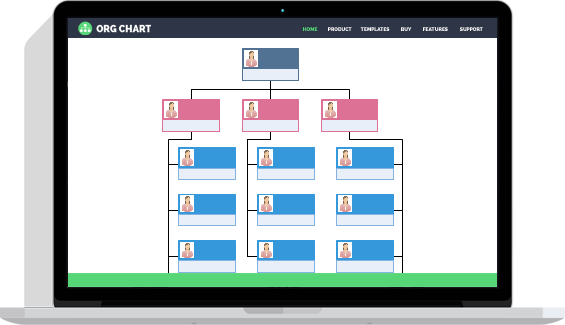
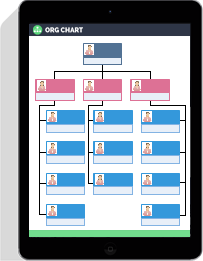
Fast and Effective Organizational Chart Solution
Powerful Functions
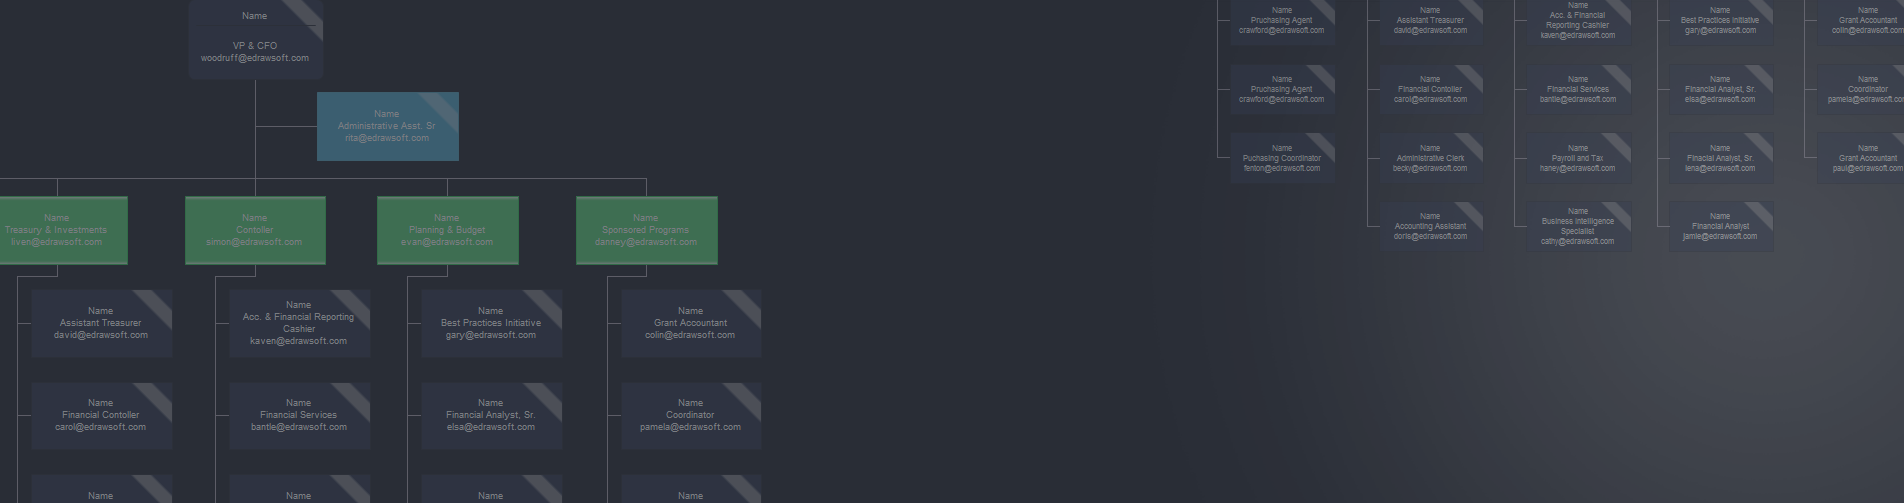
The Org Chart Creator combines multiple features which engage in providing the best org charting experience. Enjoy many advanced functions to greatly simplify your drawing process.
Easy to Use
A Microsoft-Style user interface for you to get started quickly. It’s all about dragging pre-made shapes and designing with automatic tools. Super easy and no drawing skills required.
Easy to Share
Share works with your fans and fellows even they don’t have the software. Besides, with a single click, you can export files in different formats, like MS Word, PDF, PPT, SVG, and many more.